I was very impressed after analysing how Convolutional Neural Network see the image. More about it in the link.
As any model in Machine Learning makes some mistake, I would like to try to analyze why my model made that mistakes. In order to solve this question we can use CAM and compare results. Moreover, trying to understand why model made some mistakes we have to look at confusion matrix. Confusion matrix shows us which classes were missclassified the most.
So we apload confusion matrix, that we have already seen on this post.
%matplotlib inline
import matplotlib.image as mpimg
plt.rcParams['figure.figsize'] = (22, 9)
confusion_m = mpimg.imread('/home/veronika/materials/cv/cv_organizer/presentation/confmatrix.png')
plt.imshow(confusion_m)
<matplotlib.image.AxesImage at 0x7f66ba5b8650>

class_label = pd.read_csv("/home/veronika/materials/cv/detection/class_labels.csv", sep = " ", header = None)
class_label
| 0 | 1 | |
|---|---|---|
| 0 | 0 | running/walking |
| 1 | 1 | other |
| 2 | 2 | bicycling |
| 3 | 3 | conditioning_exercise |
| 4 | 4 | dancing |
| 5 | 5 | fishing_and_hunting |
| 6 | 6 | home_activities |
| 7 | 7 | home_repair |
| 8 | 8 | lawn_and_garden |
| 9 | 9 | music_playing |
| 10 | 10 | occupation |
| 11 | 11 | sports |
| 12 | 12 | water_activities |
| 13 | 13 | winter_activities |
After analysing confusion matrix we can make the following conclusions. The most repetitive wrong predicted case was when true lable of image is “runninig/walking” and predicted class is “sports” There were 24 errors of this type. However, that cases are very similar. Other high repetitive cases are
- when true class is “home_repair”, but predicted class is “ocupation”
- when true class is “home_activities”, but predicted class is “occupation”
- when true class is “other”, but predicted class is “sports”
- when true class is “occupation”, but predicted class is “other”
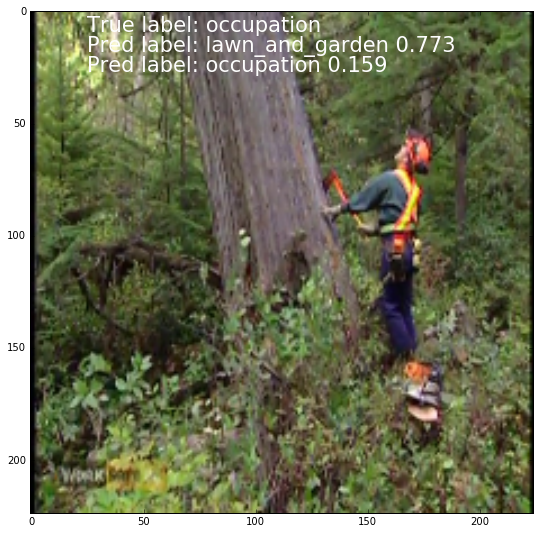
OK! Let’s look on features, that mislead our model. This analysis may help us to understand the reasons of misclassifications. It might be bad labeled images, that are difficult to classify even for human or some objects in images, that led to errors.
import caffe
import numpy as np
import cv2
import matplotlib.pylab as plt
import sys
import pandas as pd
/usr/local/lib/python2.7/dist-packages/matplotlib/font_manager.py:273: UserWarning: Matplotlib is building the font cache using fc-list. This may take a moment.
  warnings.warn('Matplotlib is building the font cache using fc-list. This may take a moment.')
plt.rcParams['figure.figsize'] = (12, 9)
deploy_file  = "/home/veronika/materials/cv/CAM/deploy_googlenetCAM.prototxt"
weights_file = "/home/veronika/materials/cv/CAM/mod2/snapshot/_iter_3000.caffemodel"

caffe.set_device(0)
caffe.set_mode_gpu()
net = caffe.Net(deploy_file, weights_file, caffe.TEST)
true_test_labels = pd.read_csv("/home/veronika/materials/cv/cv_organizer/mydata/test_labels.csv",
                               sep = " ", names=["name", "true_label"])
total_data = true_test_labels
total_data.shape
(1798, 2)
for i in true_test_labels['name']:
    img_path = "/home/veronika/materials/cv/cv_organizer/mydata/test/" + i
    image_resize = 224
    image = caffe.io.load_image(img_path)
    net.blobs['data'].reshape(1,3,image_resize,image_resize)
    transformer = caffe.io.Transformer({'data': net.blobs['data'].data.shape})
    transformer.set_transpose('data', (2, 0, 1))
    transformer.set_mean('data', np.array([104,117,123])) # mean pixel
    transformer.set_raw_scale('data', 255)  # the reference model operates on images in [0,255] range instead of [0,1]
    transformer.set_channel_swap('data', (2,1,0))

    transformed_image = transformer.preprocess('data', image)
    net.blobs['data'].data[...] = transformed_image
    detections = net.forward()['prob']
    nclass = 13
    sortedprobs = np.sort(detections)


    total_data.set_value(true_test_labels.loc[true_test_labels["name"] == i].index[0],
                         'predicted_label', np.argsort(detections)[:,nclass])

    total_data.set_value(true_test_labels.loc[true_test_labels["name"] == i].index[0],
                         'prob', sortedprobs[:,nclass])
    total_data.set_value(true_test_labels.loc[true_test_labels["name"] == i].index[0],
                         'second_predicted_label', np.argsort(detections)[:,nclass-1])
    total_data.set_value(true_test_labels.loc[true_test_labels["name"] == i].index[0],
                         'second_prob', sortedprobs[:,nclass-1])
total_data["predicted_label"] = (total_data["predicted_label"]).astype(int)
total_data["second_predicted_label"] = (total_data["second_predicted_label"]).astype(int)
total_data["true_label"] = (total_data["true_label"]).astype(int)
total_data = pd.read_csv("/home/veronika/materials/cv/predicted_labels_CAM.csv")
total_data.shape
(1798, 6)
total_data.tail(7)
| name | true_label | predicted_label | prob | second_predicted_label | second_prob | |
|---|---|---|---|---|---|---|
| 1791 | 056481278.jpg | 11 | 0 | 0.738038 | 1 | 0.210865 |
| 1792 | 001135364.jpg | 13 | 13 | 0.683123 | 9 | 0.070605 |
| 1793 | 015683370.jpg | 10 | 11 | 0.942924 | 9 | 0.038226 |
| 1794 | 001367765.jpg | 12 | 12 | 0.999849 | 7 | 0.000055 |
| 1795 | 090711742.jpg | 2 | 2 | 0.968152 | 1 | 0.031011 |
| 1796 | 043042191.jpg | 5 | 0 | 0.470264 | 5 | 0.240976 |
| 1797 | 094023024.jpg | 12 | 12 | 0.998844 | 4 | 0.000477 |
wrong_predicted = total_data[total_data["true_label"] != total_data["predicted_label"]]
wrong_predicted.tail(7)
| name | true_label | predicted_label | prob | second_predicted_label | second_prob | |
|---|---|---|---|---|---|---|
| 1777 | 000391837.jpg | 10 | 0 | 0.672848 | 1 | 0.092628 |
| 1778 | 016859905.jpg | 6 | 8 | 0.267946 | 6 | 0.266094 |
| 1781 | 000947513.jpg | 8 | 11 | 0.489302 | 1 | 0.169710 |
| 1787 | 023722679.jpg | 7 | 10 | 0.668150 | 7 | 0.210047 |
| 1791 | 056481278.jpg | 11 | 0 | 0.738038 | 1 | 0.210865 |
| 1793 | 015683370.jpg | 10 | 11 | 0.942924 | 9 | 0.038226 |
| 1796 | 043042191.jpg | 5 | 0 | 0.470264 | 5 | 0.240976 |
wrong_predicted.shape
_(431, 6)_
wrong_predicted['nindex'] = range(431)
/usr/local/lib/python2.7/dist-packages/ipykernel/__main__.py:1: SettingWithCopyWarning:
A value is trying to be set on a copy of a slice from a DataFrame.
Try using .loc[row_indexer,col_indexer] = value instead
wrong_predicted.head(7)
| name | true_label | predicted_label | prob | second_predicted_label | second_prob | nindex | |
|---|---|---|---|---|---|---|---|
| 2 | 089393351.jpg | 6 | 7 | 0.818566 | 6 | 0.125225 | 0 |
| 6 | 064173704.jpg | 1 | 11 | 0.469895 | 0 | 0.300765 | 1 |
| 9 | 033109429.jpg | 7 | 10 | 0.462610 | 7 | 0.426548 | 2 |
| 28 | 033281836.jpg | 13 | 11 | 0.467383 | 13 | 0.288317 | 3 |
| 37 | 048507291.jpg | 10 | 8 | 0.342671 | 1 | 0.255119 | 4 |
| 39 | 060381722.jpg | 10 | 7 | 0.482599 | 6 | 0.298314 | 5 |
| 52 | 067799802.jpg | 7 | 10 | 0.790746 | 7 | 0.097995 | 6 |
print("There are" + " " + str(wrong_predicted.shape[0])+" " + "wrong predicted images")
_There are 431 wrong predicted images_
def get_label(n, label_type):
    return(np.array(class_label.loc[class_label[0] == wrong_predicted.iloc[n][label_type]][1])[0])
def get_heat_map(n, argtype = "index"):
    image_resize = 224
    img_path = "/home/veronika/materials/cv/cv_organizer/mydata/test/" + np.array(wrong_predicted["name"])[n]
    image = caffe.io.load_image(img_path)
    net.blobs['data'].reshape(1,3,image_resize,image_resize)
    transformer = caffe.io.Transformer({'data': net.blobs['data'].data.shape})
    transformer.set_transpose('data', (2, 0, 1))
    transformer.set_mean('data', np.array([104,117,123])) # mean pixel
    transformer.set_raw_scale('data', 255)  # the reference model operates on images in [0,255] range instead of [0,1]
    transformer.set_channel_swap('data', (2,1,0))

    transformed_image = transformer.preprocess('data', image)
    net.blobs['data'].data[...] = transformed_image
    detections = net.forward()['prob']
    weights = net.params['CAM_fc_14'][0].data
    feature_maps = net.blobs['CAM_conv'].data[0]

    weights = np.array(weights,dtype=np.float)
    feature_maps = np.array(feature_maps,dtype=np.float)
    heat_map = np.zeros([14,14],dtype = np.float)
    for i in range(1024):
        w = weights[detections.argmax()][i]
        heat_map = heat_map + w*feature_maps[i]
    heat_map = cv2.resize(heat_map,(224,224))
    return(heat_map)
def plot_labeled_image(i):
    image_resize = 224
    img_path = "/home/veronika/materials/cv/cv_organizer/mydata/test/" + np.array(wrong_predicted["name"])[i]
    image = caffe.io.load_image(img_path)
    image = cv2.resize(image,(224,224))
    tr_label = "True label" +":"+ " " + get_label(i, "true_label")
    pred_label = "Pred label" +":"+ " " + get_label(i, "predicted_label") +" "+ str(round(wrong_predicted.iloc[i]["prob"], 3))
    snd_pred_label = "Pred label" +":"+ " " + get_label(i, "second_predicted_label") +" "+ str(round(wrong_predicted.iloc[i]["second_prob"], 3))
    plt.text(25, 0.04*image.shape[1], tr_label, {'color': 'w', 'fontsize': 21})
    plt.text(25, 2*0.04*image.shape[1], pred_label, {'color': 'w', 'fontsize': 21})
    plt.text(25, 3*0.04*image.shape[1], snd_pred_label, {'color': 'w', 'fontsize': 21})
    plt.imshow(get_heat_map(i), alpha=0.4, interpolation='nearest')
    plt.imshow(image)
    return(plt.show())
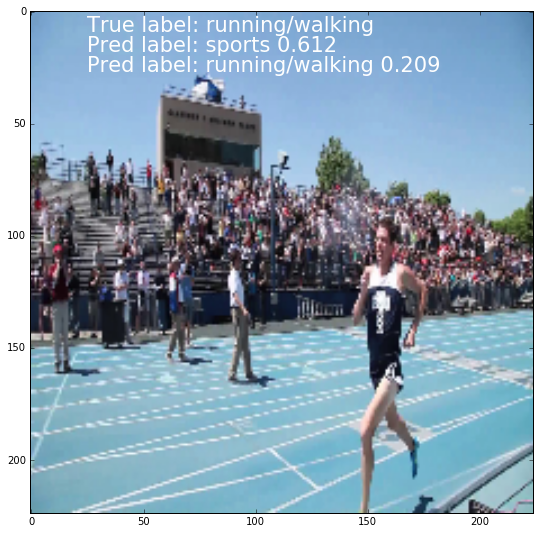
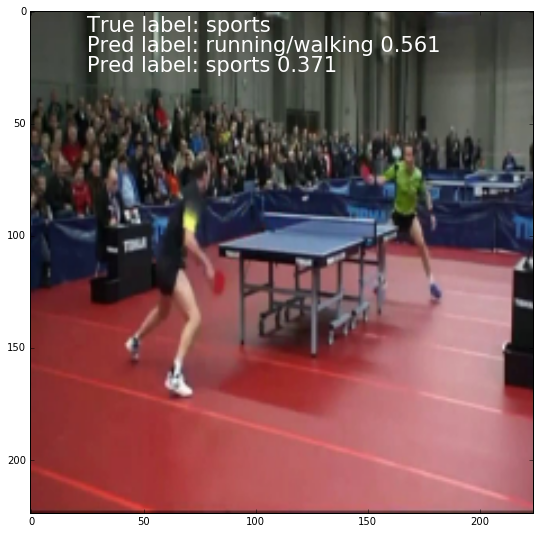
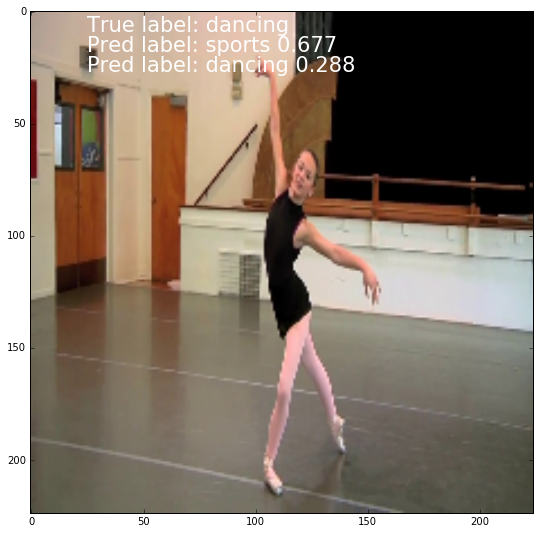
Now, we will look at most repetitive error cases (true class of image is “runninig/walking” and predicted class is “sports”)
wrong_predicted.loc[wrong_predicted["true_label"] == 0][wrong_predicted["predicted_label"] == 11].head(12)
| name | true_label | predicted_label | prob | second_predicted_label | second_prob | nindex | |
|---|---|---|---|---|---|---|---|
| 196 | 008058081.jpg | 0 | 11 | 0.816078 | 0 | 0.165102 | 40 |
| 217 | 091082626.jpg | 0 | 11 | 0.611820 | 0 | 0.208546 | 45 |
| 224 | 012324746.jpg | 0 | 11 | 0.857252 | 3 | 0.092970 | 46 |
| 390 | 069342584.jpg | 0 | 11 | 0.483682 | 0 | 0.372490 | 90 |
| 393 | 030264034.jpg | 0 | 11 | 0.988194 | 0 | 0.008093 | 91 |
| 450 | 057277028.jpg | 0 | 11 | 0.783435 | 0 | 0.151723 | 106 |
| 482 | 025283378.jpg | 0 | 11 | 0.805813 | 0 | 0.166451 | 114 |
| 676 | 074163782.jpg | 0 | 11 | 0.904602 | 0 | 0.073850 | 164 |
| 728 | 005773628.jpg | 0 | 11 | 0.450017 | 6 | 0.288198 | 180 |
| 787 | 085793065.jpg | 0 | 11 | 0.634702 | 13 | 0.205134 | 195 |
| 879 | 095797935.jpg | 0 | 11 | 0.880209 | 0 | 0.091266 | 221 |
| 904 | 004997903.jpg | 0 | 11 | 0.548356 | 0 | 0.420405 | 226 |
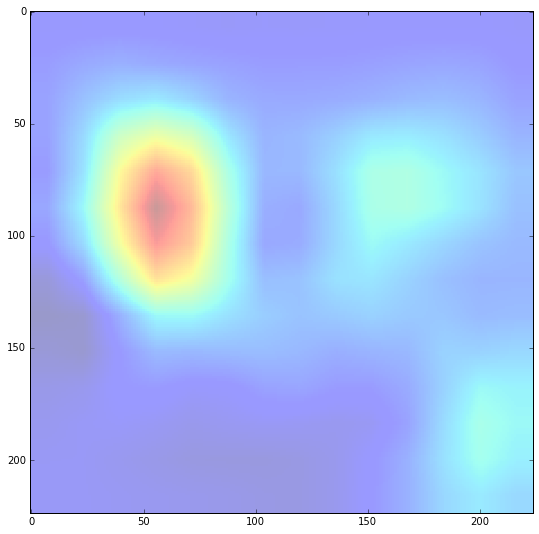
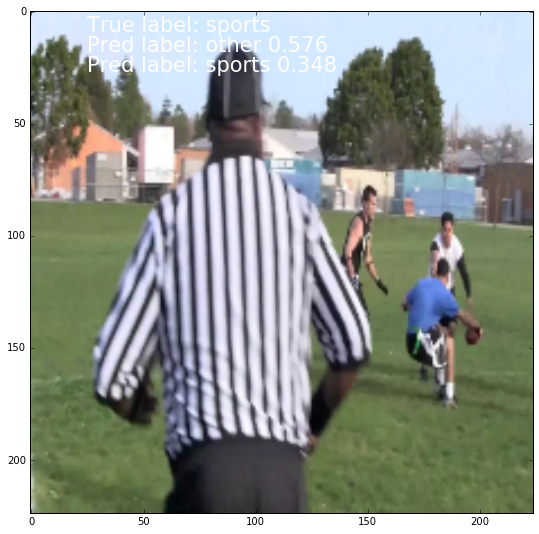
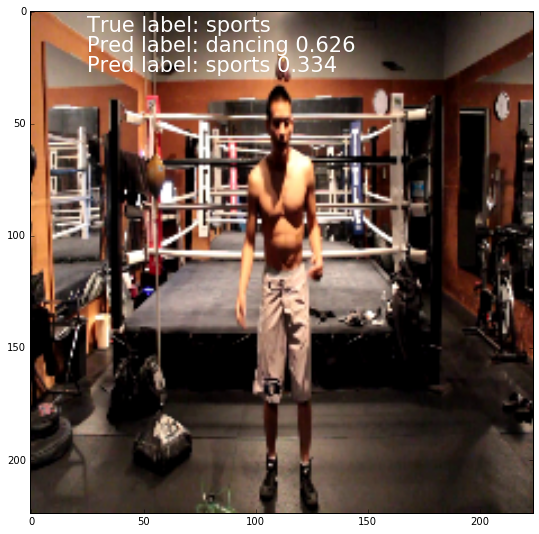
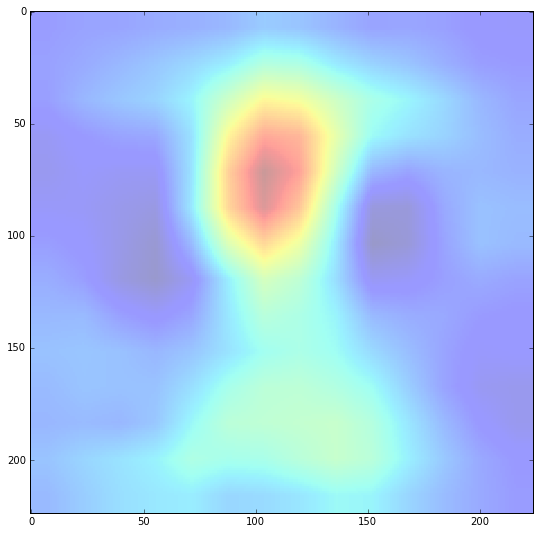
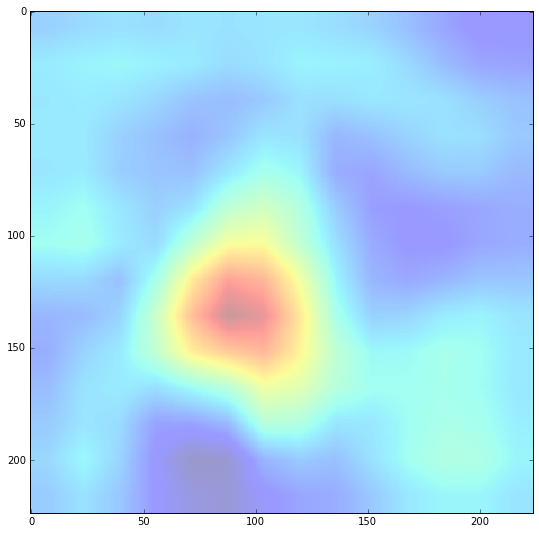
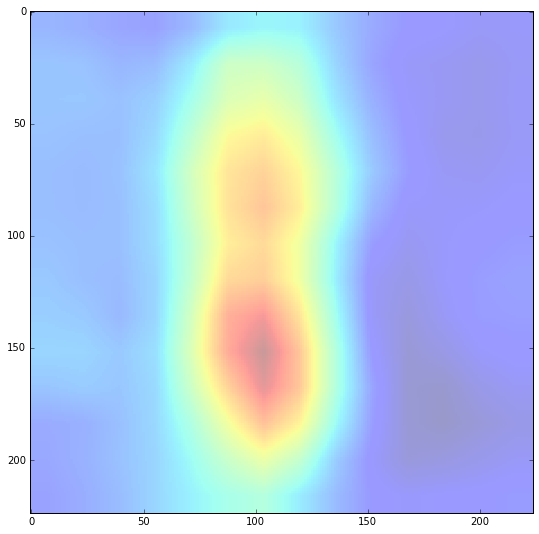
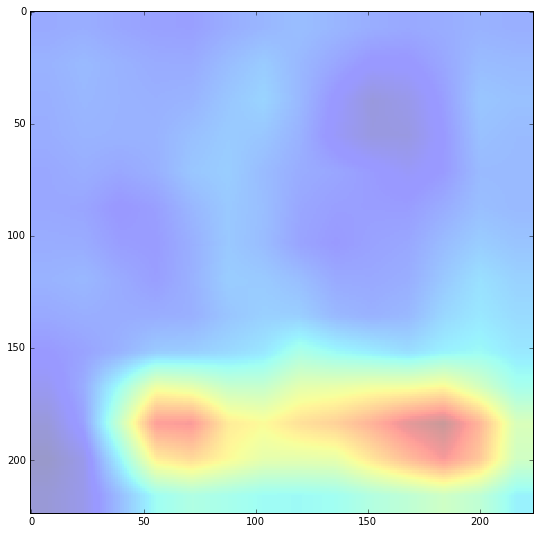
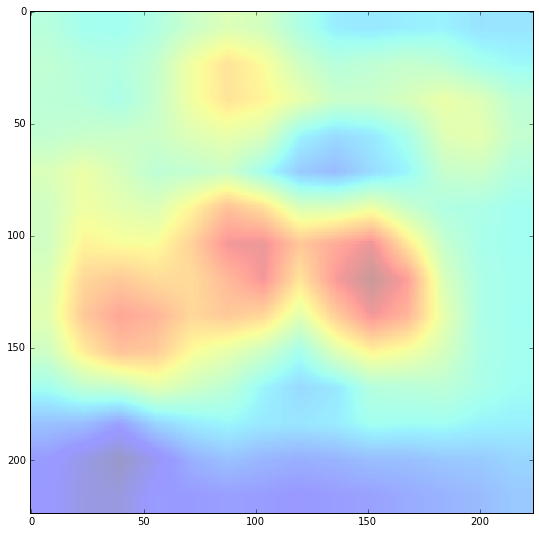
In the picture bellow we can see that ConvNet has fixed correctly on a person, but doesn’t manage to classify it to correct label. Also, the correct label was defined with 16.5%.
n = 40
plot_labeled_image(n)
plt.imshow(get_heat_map(n), alpha=0.4, interpolation='nearest')

<matplotlib.image.AxesImage at 0x7f66b9e2d290>

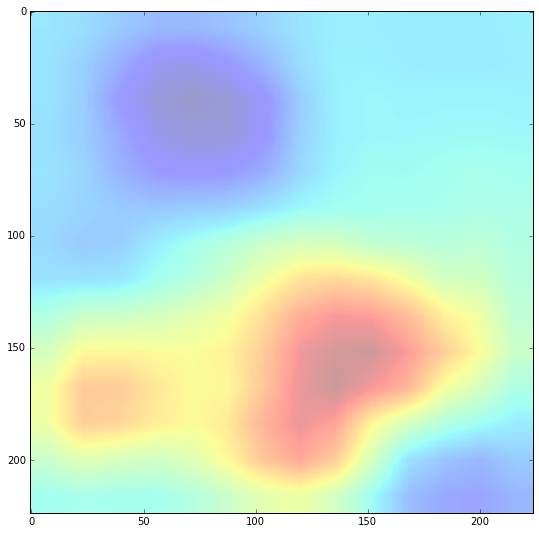
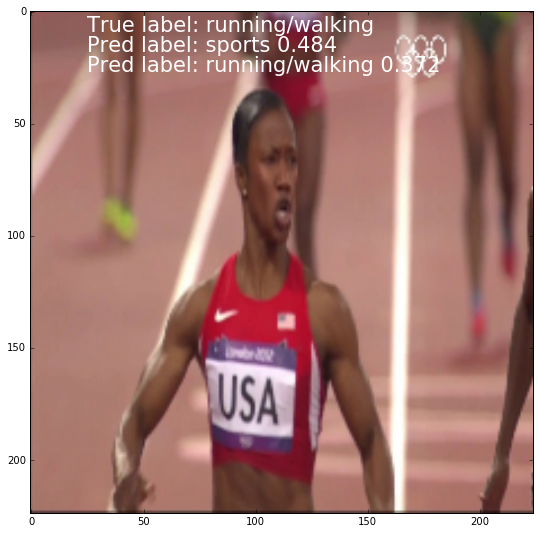
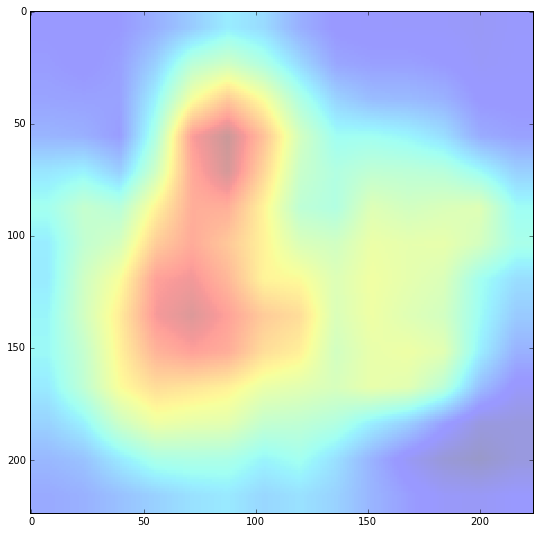
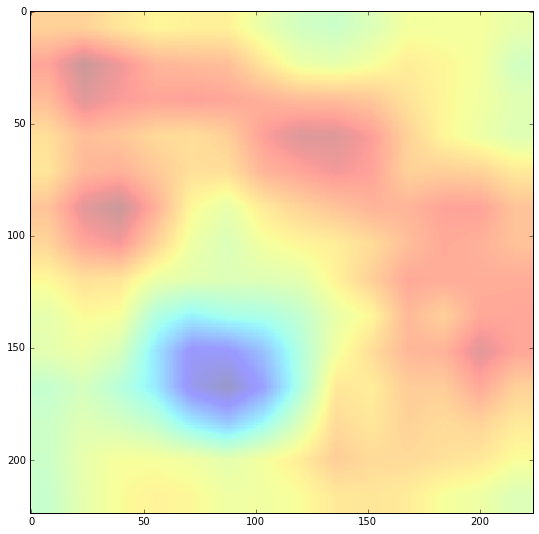
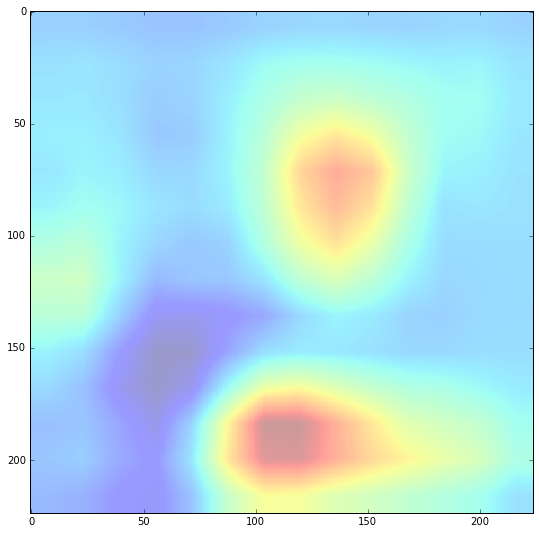
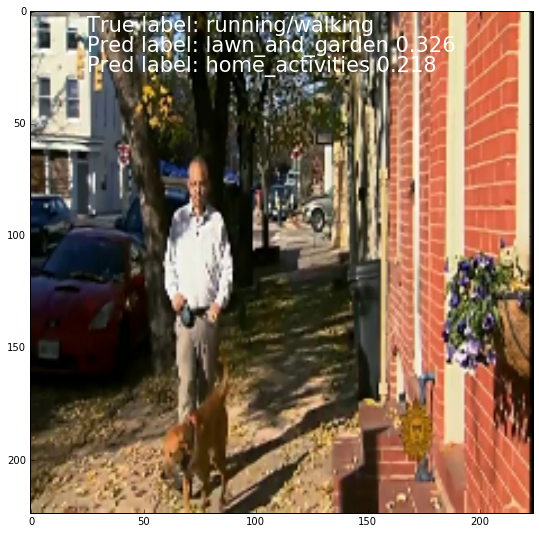
In his case, the ConvNet didn’t detect the person.
n = 45
plot_labeled_image(n)
plt.imshow(get_heat_map(n), alpha=0.4, interpolation='nearest')
<matplotlib.image.AxesImage at 0x7f66b965b550>
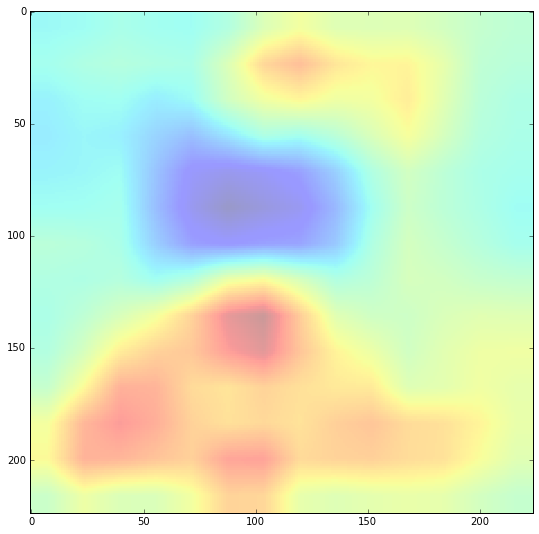
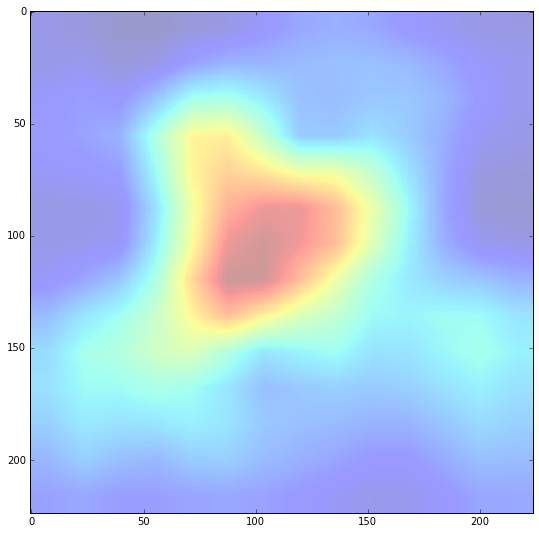
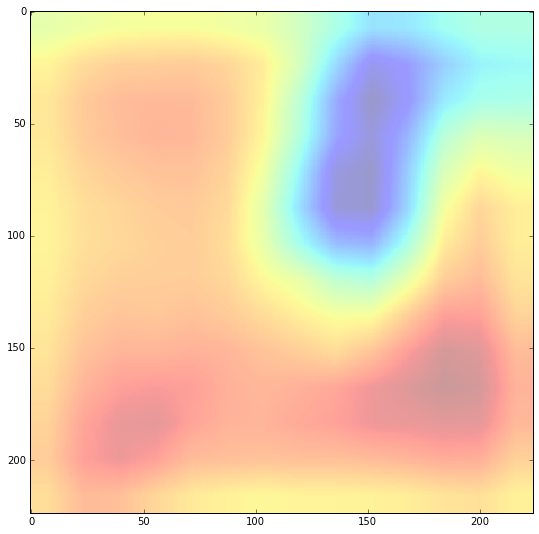
Let’s look at the next image. I think that it is not easy to detect the running activities at the image,as we can’t see the whole person. Nevertheless, the probability of correct class is high.
n = 90
plot_labeled_image(n)
plt.imshow(get_heat_map(n), alpha=0.4, interpolation='nearest')
<matplotlib.image.AxesImage at 0x7f66b9f59f10>
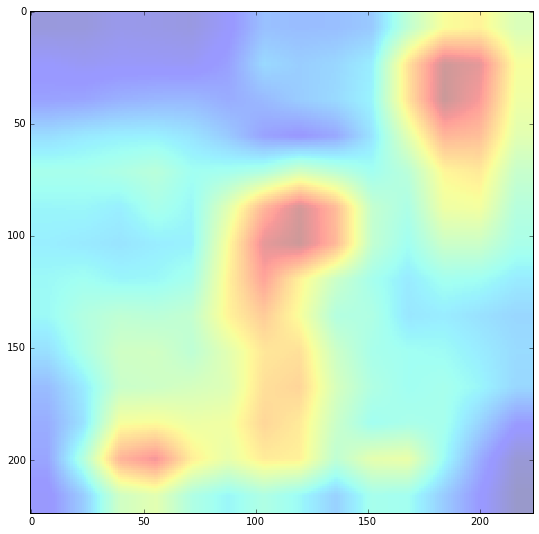
The same situation as above
n = 114
plot_labeled_image(n)
plt.imshow(get_heat_map(n), alpha=0.4, interpolation='nearest')

<matplotlib.image.AxesImage at 0x7f66b95adc90>
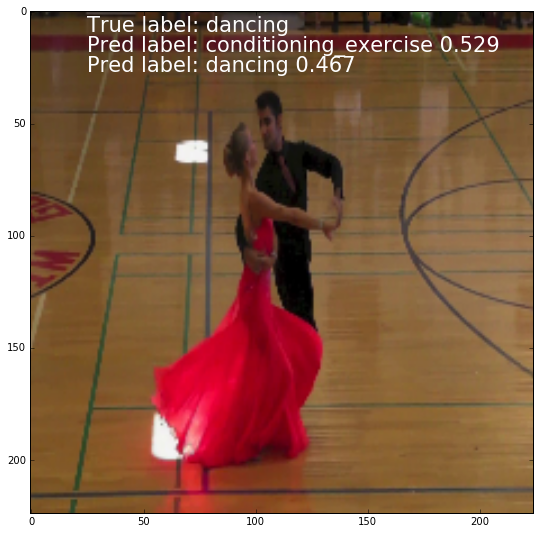
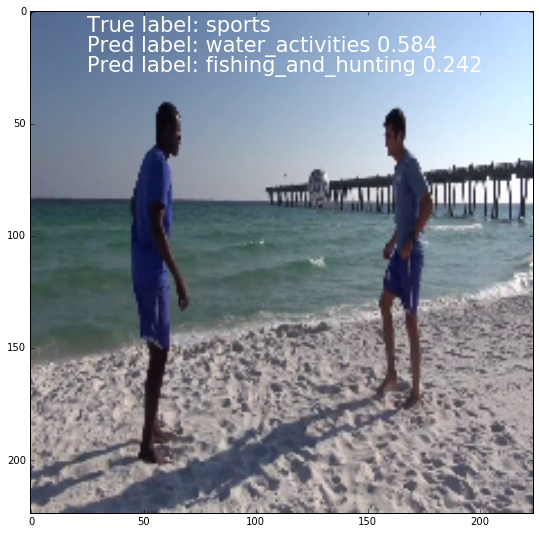
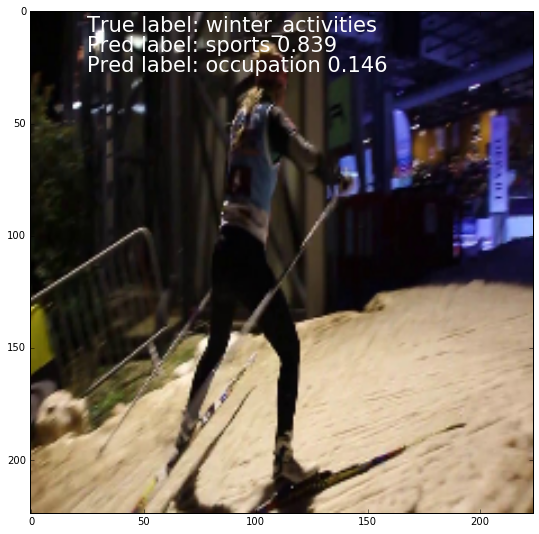
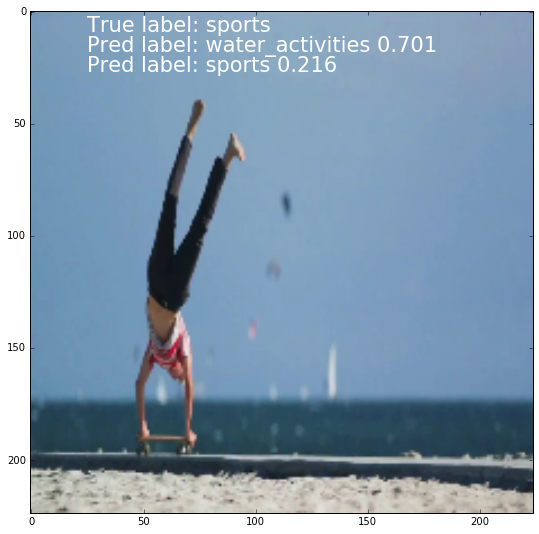
As we can see, not only the model made mistakes, but human too. As there are a lot of cases of not very clear labeling. You may check it looking at images bellow.
n = 4
plot_labeled_image(n)
plt.imshow(get_heat_map(n), alpha=0.4, interpolation='nearest')

<matplotlib.image.AxesImage at 0x7f66c0c13b10>

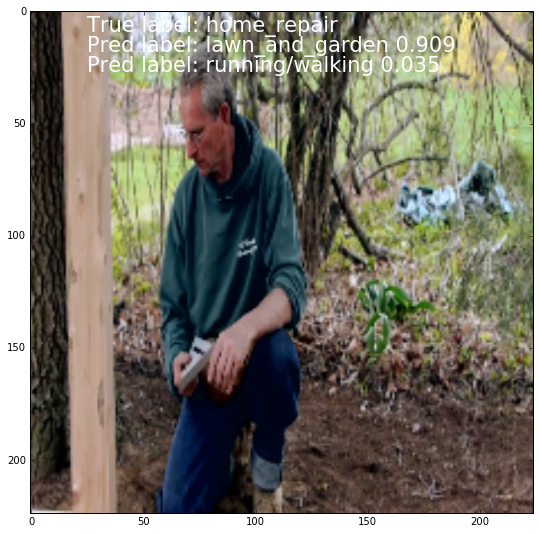
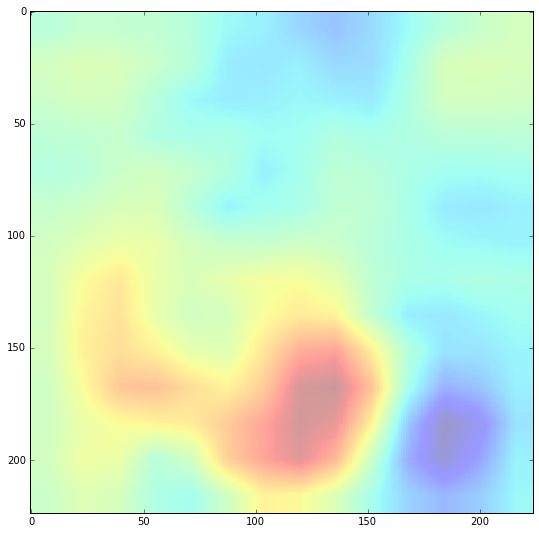
n = 7
plot_labeled_image(n)
plt.imshow(get_heat_map(n), alpha=0.4, interpolation='nearest')

<matplotlib.image.AxesImage at 0x7f66c0043e10>

n = 10
plot_labeled_image(n)
plt.imshow(get_heat_map(n), alpha=0.4, interpolation='nearest')
<matplotlib.image.AxesImage at 0x7f66c16a8d50>
n = 11
plot_labeled_image(n)
plt.imshow(get_heat_map(n), alpha=0.4, interpolation='nearest')

<matplotlib.image.AxesImage at 0x7f66bbf2bbd0>
n = 12
plot_labeled_image(n)
plt.imshow(get_heat_map(n), alpha=0.4, interpolation='nearest')

<matplotlib.image.AxesImage at 0x7f66bbbe7790>

n = 14
plot_labeled_image(n)
plt.imshow(get_heat_map(n), alpha=0.4, interpolation='nearest')
<matplotlib.image.AxesImage at 0x7f66bbb53350>
![png]/img/post6/output_40_2.png)
n = 15
plot_labeled_image(n)
plt.imshow(get_heat_map(n), alpha=0.4, interpolation='nearest')
<matplotlib.image.AxesImage at 0x7f66bbd6da90>

n = 16
plot_labeled_image(n)
plt.imshow(get_heat_map(n), alpha=0.4, interpolation='nearest')

<matplotlib.image.AxesImage at 0x7f66c0d71690>
n = 19
plot_labeled_image(n)
plt.imshow(get_heat_map(n), alpha=0.4, interpolation='nearest')
<matplotlib.image.AxesImage at 0x7f66bb7b9610>

n = 20
plot_labeled_image(n)
plt.imshow(get_heat_map(n), alpha=0.4, interpolation='nearest')

<matplotlib.image.AxesImage at 0x7f66bb9201d0>
n = 35
plot_labeled_image(n)
plt.imshow(get_heat_map(n), alpha=0.4, interpolation='nearest')
<matplotlib.image.AxesImage at 0x7f66bbe28f50>
n = 36
plot_labeled_image(n)
plt.imshow(get_heat_map(n), alpha=0.4, interpolation='nearest')
<matplotlib.image.AxesImage at 0x7f66bb7703d0>
![png]/img/post6/(output_46_2.png)
n = 60
plot_labeled_image(n)
plt.imshow(get_heat_map(n), alpha=0.4, interpolation='nearest')
<matplotlib.image.AxesImage at 0x7f66bb11bdd0>
n = 68
plot_labeled_image(n)
plt.imshow(get_heat_map(n), alpha=0.4, interpolation='nearest')

<matplotlib.image.AxesImage at 0x7f66baf53990>

n = 69
plot_labeled_image(n)
plt.imshow(get_heat_map(n), alpha=0.4, interpolation='nearest')

<matplotlib.image.AxesImage at 0x7f66badc1550>
n = 75
plot_labeled_image(n)
plt.imshow(get_heat_map(n), alpha=0.4, interpolation='nearest')

<matplotlib.image.AxesImage at 0x7f66bb0a5910>
n = 78
plot_labeled_image(n)
plt.imshow(get_heat_map(n), alpha=0.4, interpolation='nearest')

<matplotlib.image.AxesImage at 0x7f66bb2aa2d0>
n = 87
plot_labeled_image(n)
plt.imshow(get_heat_map(n), alpha=0.4, interpolation='nearest')

<matplotlib.image.AxesImage at 0x7f66bbe20890>

n = 88
plot_labeled_image(n)
plt.imshow(get_heat_map(n), alpha=0.4, interpolation='nearest')
<matplotlib.image.AxesImage at 0x7f66bb1c25d0>

n = 95
plot_labeled_image(n)
plt.imshow(get_heat_map(n), alpha=0.4, interpolation='nearest')
<matplotlib.image.AxesImage at 0x7f66baee1190>

n = 99
plot_labeled_image(n)
plt.imshow(get_heat_map(n), alpha=0.4, interpolation='nearest')

<matplotlib.image.AxesImage at 0x7f66baac5d10>

n = 103
plot_labeled_image(n)
plt.imshow(get_heat_map(n), alpha=0.4, interpolation='nearest')
<matplotlib.image.AxesImage at 0x7f66babaa8d0>

n = 104
plot_labeled_image(n)
plt.imshow(get_heat_map(n), alpha=0.4, interpolation='nearest')

<matplotlib.image.AxesImage at 0x7f66baaa1410>
n = 110
plot_labeled_image(n)
plt.imshow(get_heat_map(n), alpha=0.4, interpolation='nearest')

<matplotlib.image.AxesImage at 0x7f66bb0449d0>
n = 118
plot_labeled_image(n)
plt.imshow(get_heat_map(n), alpha=0.4, interpolation='nearest')
<matplotlib.image.AxesImage at 0x7f66bb7c8a90>

n = 121
plot_labeled_image(n)
plt.imshow(get_heat_map(n), alpha=0.4, interpolation='nearest')

<matplotlib.image.AxesImage at 0x7f66baf1e950>
n = 122
plot_labeled_image(n)
plt.imshow(get_heat_map(n), alpha=0.4, interpolation='nearest')

<matplotlib.image.AxesImage at 0x7f66ba8db510>

n = 9
plot_labeled_image(n)
plt.imshow(get_heat_map(n), alpha=0.4, interpolation='nearest')

<matplotlib.image.AxesImage at 0x7f66ba6a6c50>