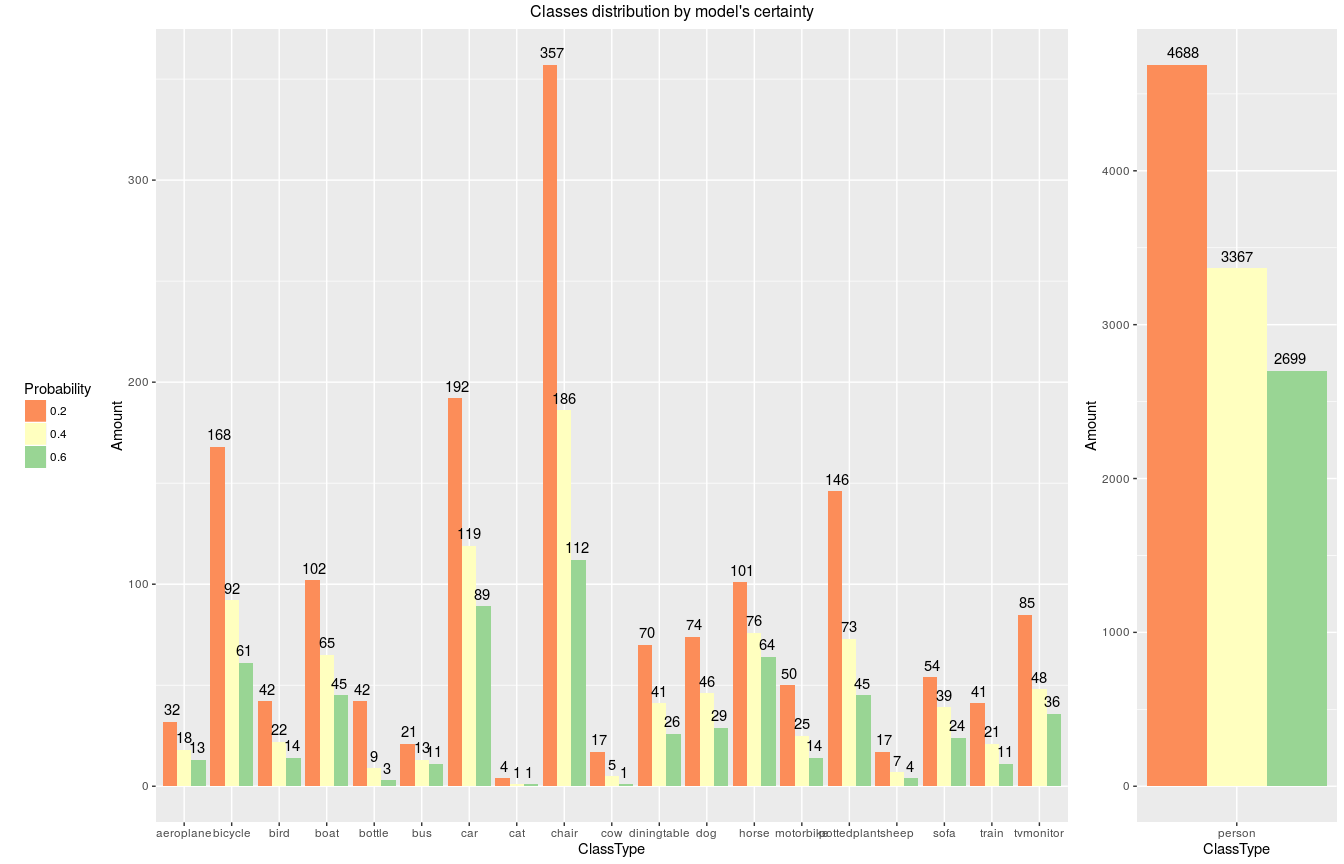
Class distribution by probabilities in all test dataset
This file is written using R. Just because I love R and it is very easy to visualize any plots with ggplot library.
The csv file is a dataframe, that we got in previous post in Part2
data_to_plot = read.csv("/home/veronika/materials/cv/detection/total_classes.csv")

head(data_to_plot)
##   X ClassType  Probs Amount
## 1 0     sheep Prob02     17
## 2 1    bottle Prob02     42
## 3 2     horse Prob02    101
## 4 3   bicycle Prob02    168
## 5 4 motorbike Prob02     50
## 6 5       cow Prob02     17
library(ggplot2)
library(grid)
library(gridExtra)

p1 = ggplot(data=data_to_plot[data_to_plot$ClassType != "person",], aes(x=ClassType, y=Amount,
                    fill=factor(Probs, labels = c("0.2", "0.4", "0.6")))) +
  geom_bar(stat="identity", position=position_dodge())+
  theme(legend.position = "left")+
  labs(fill = "Probability")+scale_fill_brewer(palette="Spectral")+
  geom_text(aes(label = Amount, x = ClassType, y = Amount), position = position_dodge(width = 0.8), vjust = -0.6)


p2 = ggplot(data=data_to_plot[data_to_plot$ClassType == "person",], aes(x=ClassType, y=Amount, fill=Probs)) +
  geom_bar(stat="identity", position=position_dodge())+scale_fill_brewer(palette="Spectral")+
  theme(legend.position = "none")+
  geom_text(aes(label = Amount, x = ClassType, y = Amount), position = position_dodge(width = 0.8), vjust = -0.6)


grid.arrange(p1, p2, ncol=5, nrow=1, layout_matrix = rbind(c(1,1,1,1,2)),
             top = "Classes distribution by model's certainty")